
El Niño Watch Raises Odds, Not Certainty, for California’s Next Wet Season
Federal scientists have issued an El Niño Watch for this summer, reflecting a growing likelihood that the tropical Pacific will shift into El Niño conditions. The National Oceanic and Atmospheric Administration (NOAA) put the chance of El Niño conditions at 62% from June through August, rising to 83% by October.
Those probabilities have already fueled dramatic language in headlines and social media, with talk of “Super El Niños” and other ominous labels. But the practical meaning for California—especially for winter rain—requires a more careful explanation. El Niño influences the odds of certain patterns, yet it does not lock in a guaranteed outcome.
Jan Null, a veteran meteorologist who spent decades with the National Weather Service and now runs a forecasting and consulting firm in Half Moon Bay, has long emphasized the difference between probability and certainty. His perspective is rooted both in historical records and in the limits of what forecasting can realistically deliver.
What El Niño and La Niña actually are
At its core, El Niño is a warming of ocean waters in the tropical Pacific along the equator, spanning from waters just off Mexico to the central Pacific. It tends to occur every three to seven years. La Niña is the opposite phase: cooler-than-normal ocean waters in that same region.
These changes in ocean temperature are not just a marine curiosity. They can alter atmospheric circulation patterns, and those shifts can ripple outward, affecting weather well beyond the tropics. The key point, Null notes, is that the influence is broad and statistical. It is not a simple switch that flips one specific type of weather on and off everywhere.
Global and regional effects: broad tendencies, not guarantees
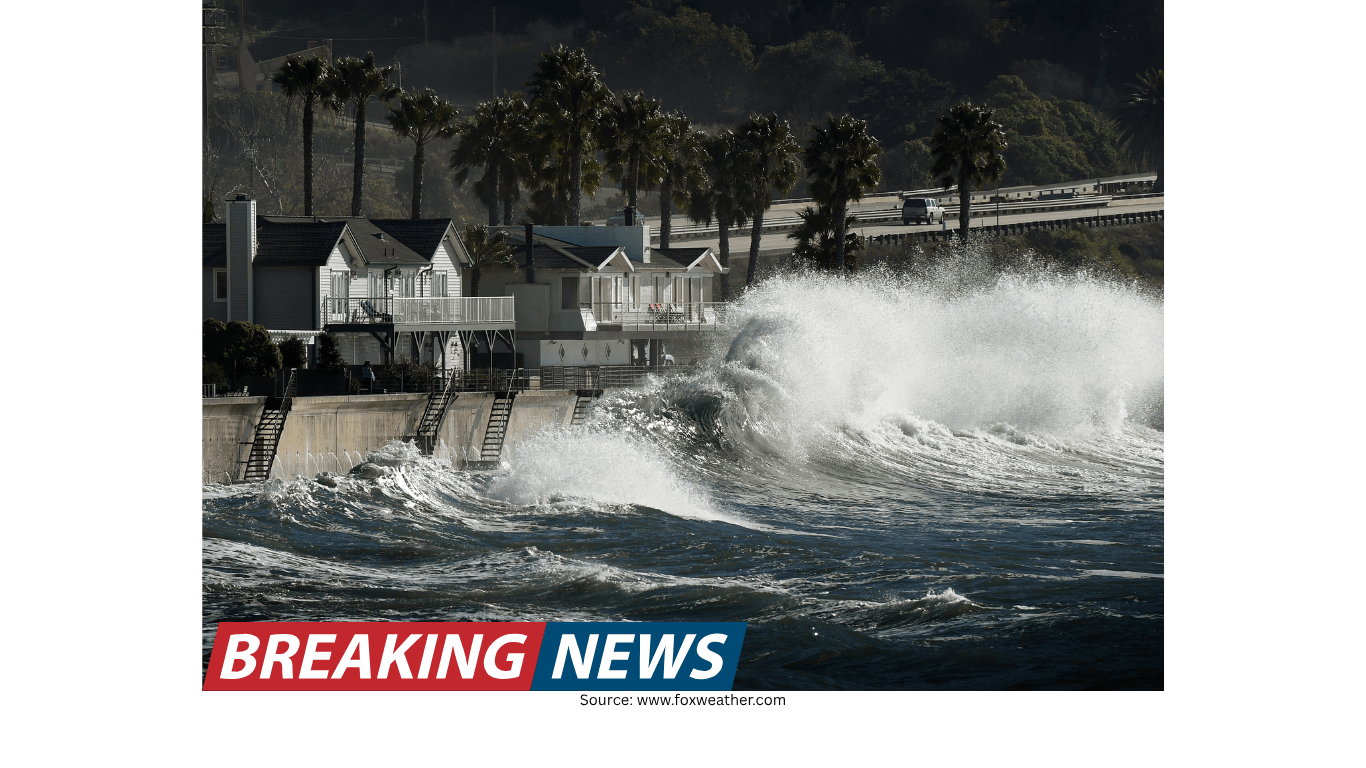
In broad terms, El Niño is associated with a set of average tendencies across different regions. In North America, the pattern is more likely to bring warmer and drier conditions to the Pacific Northwest and Canada, while increasing the odds of wetter-than-normal conditions across the southern tier of the United States, including Southern California.
Outside North America, El Niño is associated with drier-than-normal conditions in the Amazon Basin, and also drier-than-normal conditions in Indonesia and Australia.
El Niño is also linked to shifts in hurricane activity. During El Niño years, hurricane activity in the Atlantic tends to decrease—though it does not drop to zero, and hurricanes can still occur. Meanwhile, the eastern Pacific off Mexico and Central America tends to see hurricane numbers increase during El Niño years.
These are trends based on averages over many years, and that caveat matters. One of the most persistent misconceptions, Null argues, is treating these relationships as absolute rules rather than statistical tendencies.
The California misconception: El Niño does not automatically mean a wet winter
California’s relationship with El Niño is often simplified into a slogan: El Niño equals wet winters; La Niña equals drought. The historical record does not support that level of certainty.
Null’s summary of the data is straightforward: on average, much of California tends to be wetter during El Niño. But “on average” hides wide swings from one event to another.
Since 1950, there have been 27 El Niño events. In the Bay Area, rainfall was below normal in 12 of those El Niño years and above normal in the other 15. In Los Angeles, 10 El Niño years had below-normal rainfall and 17 had above-normal rainfall.
That split leads to a practical takeaway that is easy to miss amid the hype: El Niño does not guarantee above-normal rainfall anywhere in California. What it does is tilt the odds. And even that tilt varies by region. The frequency of above-normal rainfall during El Niño is greater in Southern California than in the Bay Area, and it becomes less pronounced farther north.
Why “Super El Niño” narratives persist
Public expectations around El Niño have been shaped by memorable seasons, especially those associated with very strong events. Null points to the winter of 1997–98 as a major reference point. That season was heavily hyped, and it delivered: double the normal rainfall and many rainy days. Experiences like that can cement a public impression that a strong El Niño automatically means a soaking winter.
In recent history, Null identifies three very strong El Niño events: 1982–83, 1997–98, and 2015–16. These were years when tropical Pacific water temperatures were at the high end of the scale, placing them in the “very strong” category.
Two of those three strong events brought notably wet outcomes in the Bay Area. In 1982–83, the Bay Area saw 195% of normal rainfall along with flooding. In 1997–98, it saw 180% of normal rainfall. But 2015–16 did not follow the same script: rainfall was 99% of normal.
The lesson, as Null frames it, is not that strong El Niño events are irrelevant. Rather, it is that even the strongest category does not produce the same result every time. Two out of three were wet in the Bay Area, but it was not three out of three—and that difference is exactly why forecasts should be understood as probabilities, not promises.
Climate change and El Niño: a developing area of understanding
Null describes the connection between climate change and El Niño impacts as an area where scientists are still “getting a handle” on what is changing and how to measure it. One clear backdrop is that oceans are warmer. He also notes that when storms do occur, they tend to be wetter, and when droughts and heat waves occur, they tend to be drier and hotter.
His broader framing is that every weather event now carries some “climate change DNA.” The difficult part is separating what is natural variability from what has been intensified by a hotter climate. He argues that the right way to evaluate that question is to look at longer time spans—decadal numbers—across the 1980s, 1990s, 2000s, 2010s, and 2020s to see how the frequency of wet events changes over time.
How forecasting has improved—and what it still cannot do
Weather forecasting has made major strides over the last several decades, but those improvements have not eliminated uncertainty. Null offers a simple benchmark from his career: when he began forecasting in the 1970s, a “good forecast” extended about three days. Today, it is about seven days, meaning forecasters generally have a solid handle on expected conditions out to roughly a week.
He estimates the field has improved by about one day of useful forecast skill per decade. He attributes that progress primarily to increasing computing power, satellites, and the expansion of buoy networks in areas that previously lacked sufficient data. More observations mean more data points feeding into computer models, which improves the model output.
Null also points to the emerging use of artificial intelligence as a tool to analyze more data, especially historical data, to identify patterns. In this view, AI is not presented as a magic replacement for meteorology, but as another method for extracting insight from the growing volume of observations and past records.
Why seasonal El Niño outlooks exist when daily forecasts are limited
A common question arises whenever NOAA issues an El Niño Watch months in advance: if daily weather forecasts are only reliable about a week out, how can agencies talk about probabilities for July, August, September, or beyond?
Null’s answer is that these are different kinds of forecasts. Long-range outlooks are built from current ocean temperatures and atmospheric changes, combined with variations on climate models. They do not attempt to predict the exact weather on a specific day months from now. Instead, they estimate broader probabilities for conditions to develop, such as the likelihood that El Niño will form or persist.
In other words, the long-range outlook is not “apples and oranges” with a daily forecast, but it is a different product designed for a different level of precision. The output is general probabilities, not a detailed schedule of storms.
Why better long-range prediction would be economically valuable
Even with improved tools, Null is blunt about the limits: forecasters are not yet “that good at predicting very far out,” even though the science continues to advance. The reason the question keeps coming up is that the payoff would be enormous if precise seasonal prediction were possible.
Null notes that roughly one-third of the U.S. economy is weather sensitive. More accurate long-range forecasts could influence energy prices, agriculture, and commerce broadly, down to retail decisions such as how many winter jackets to stock for a given season. The economic incentive helps explain why seasonal outlooks are closely watched even when they are probabilistic.
Misconceptions that shape public expectations
Null highlights several recurring misunderstandings that can distort how people interpret forecasts.
Overconfidence in phone apps: One issue that bothers him most is the way many people treat weather apps as definitive. He argues that people often assume that if a forecast appears on a phone, it must be exactly what will happen.
Confusing probabilities with certainty: El Niño and La Niña shift the odds, but they do not guarantee a particular outcome for California rainfall. The relationship is not one-to-one, and it varies by region within the state.
Assuming strong El Niño equals extreme rain everywhere: Even very strong events have produced different outcomes, including a near-normal rainfall year in 2015–16 in the Bay Area.
For those looking for more grounded information, Null recommends using official local forecasts from the National Weather Service. He also points to an app called “Everything Weather,” which is based on National Weather Service forecast data.
What an El Niño Watch should mean for Californians
NOAA’s El Niño Watch is an early signal that the tropical Pacific may be shifting toward El Niño conditions, with probabilities increasing from summer into fall. That information can be useful for planners and the public alike, but it should be interpreted carefully.
The most defensible conclusion from the historical record presented by Null is that El Niño increases the likelihood of wetter conditions in parts of California, particularly Southern California, but it does not ensure a wet winter statewide. The Bay Area’s history alone shows meaningful variability, with a substantial share of El Niño years still ending up below normal.
In practice, that means residents, businesses, and local agencies may treat an El Niño Watch as a reason to pay closer attention—not as a guarantee of flooding rains, and not as a reason to dismiss the possibility of a less dramatic season. The atmosphere can follow the averages, or it can deviate sharply from them.
Jan Null’s background in forecasting and meteorology
Null’s perspective comes from a long career in operational forecasting and meteorological education. He worked as a National Weather Service forecaster from 1974 to 1997 and served as a lead forecaster from 1983 to 1997. Since 1997, he has run Golden Gate Weather Services, a consulting firm. He also taught meteorology as an adjunct professor and lecturer at San Francisco State University from 1987 to 2012, and at San Jose State University from 2013 to 2016.
He earned a B.S. in Atmospheric Science from UC Davis in 1974 and later completed an M.A. in geography/climate at San Jose State University in 1992.
Beyond meteorology, he is a Vietnam veteran who served in the U.S. Army from 1968 to 1970, working on helicopter radio systems and flying in more than 50 combat missions. He is also an amateur photographer whose work has appeared in magazines, and he has advocated warning parents about the dangers of leaving children in hot cars through a project called noheatstroke.org.